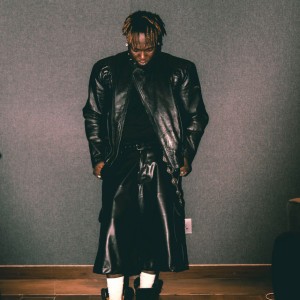
Dead and Company
Top Brand Affinity
Highest overlapping lifestyle brand
As of 2025-08-21
727,277
Social Media Followers
As of 2025-08-21
00:00:00
Hours Airplay
2026-01-21 21:53:44 UTC
Genres
Biography
Known for their record-breaking stadium performances, Dead & Company has headlined iconic venues such as Folsom Field, Autzen Stadium, and Dodger Stadium. Their 2018 Summer Tour ranked in the top 25 of the Top 100 Worldwide Tours, with consecutive years of their Summer Tours landing in the top 15 of the Top Global Concert Tours. The band's success and enduring popularity solidify their status as a powerhouse in the live music scene.
Dead and Company is already in the conversation with 25-34 & 45-64 audiences in UNITED STATES, BRAZIL, CANADA. The audience is heavily male (82%), so brand cues around fashion, access, and lifestyle earn attention. Tiktok produces steady reach (14,450 avg views per post); Instagram confirms credibility in-thread. Affinity proximity to Live Nation, Barstool Sports, Verizon points directly to streetwear, music platforms, and lifestyle products. For marketers, it’s a plug-and-play route to relevance.
Artist Affinity estimates how strongly an artist's audience overlaps with interest in specific brands, products, and categories. It is derived from aggregated social and behavioral signals—who fans follow, save, click, and engage with—normalized across platforms. Higher affinity suggests better partnership fit and higher likelihood that fans will respond positively to branded content or offers. Use it to shortlist natural brand partners and product concepts that feel authentic to the audience. Combine affinity with Connection Strength (ER) and reach to balance fit with impact. Treat affinity as directional—validate with creative tests and small pilots before scaling.
Audience Demographics & Key Stats
| Metric | Value | Why It Matters |
|---|---|---|
| Social Snapshot |
Followers 727,277 · Engagements 6,114 · Rate 0.8% Posts 2,228 · Views 19,833 · Avg Likes 5,984 · Avg Comments 143 · Avg Views 19,833 |
Combine reach (followers/views) with ER to size both impact and responsiveness. |
| Age Breakdown |
25-34: 29% 45-64: 25% 35-44: 24% 18-24: 19% |
Largest: 25-34 (29%); next: 45-64 (25%) |
| Gender Split |
Female: 18% Male: 82% Non-binary/Other: 0% |
Skews male (82%) |
| Top Countries |
UNITED STATES (72%) BRAZIL (4%) CANADA (4%) UNITED KINGDOM (3%) NIGERIA (2%) |
Top regions: UNITED STATES (72%), BRAZIL (4%), CANADA (4%) |
| Platform Engagement | Instagram: 4,683 avg likes/post · Tiktok: 14,450 avg views/post · Youtube: 5,383 avg views/post | Best reach: Tiktok 14,450 avg views; best engagement: Instagram 4,683 avg likes |
Top Brand Affinities
Live Nation
Barstool Sports
Verizon
Coors
Gillette
Bonneville
Pro Tools
Paramount Pictures
Lululemon Athletica
Busch
Margaritaville
Free People
| Brand | Category | Score |
|---|---|---|
| Live Nation | 27.94 | |
| Barstool Sports | 13.35 | |
| Verizon | 12.06 | |
| Coors | 11.11 | |
| Gillette | 8.16 | |
| Bonneville | 7.90 | |
| Pro Tools | 7.41 | |
| Paramount Pictures | 5.63 | |
| Lululemon Athletica | 5.28 | |
| Busch | 5.15 | |
| Margaritaville | 5.13 | |
| Free People | 5.09 | |
| Pacific Northwest Wonderland | 5.08 | |
| American Airlines | 4.77 | |
| Taco Bell | 4.66 | |
| Ableton | 4.62 | |
| Bud Light | 4.56 | |
| Chick-fil-A | 4.43 | |
| NHL | 4.33 | |
| Nixon | 4.30 | |
| Carhartt | 4.28 | |
| Coachella | 4.23 | |
| Budweiser | 4.18 | |
| ESPN | 3.94 | |
| Cadillac | 3.91 | |
| Lollapalooza | 3.82 | |
| FedEx | 3.78 | |
| Bethesda Softworks | 3.59 | |
| Heinz | 3.56 | |
| Comedy Central | 3.33 | |
| NFL | 3.26 | |
| Guinness | 3.14 | |
| Gatorade | 3.11 | |
| Showtime | 3.02 | |
| NBC | 2.99 | |
| Urban Outfitters | 2.94 | |
| Philips | 2.76 | |
| Chipotle Mexican Grill | 2.74 | |
| Pepsi | 2.72 | |
| Dr. Martens | 2.69 | |
| Nickelodeon | 2.65 | |
| Spotify Music | 2.59 | |
| Columbia Pictures | 2.58 | |
| Martini | 2.43 | |
| Airbnb | 2.42 | |
| Pixar | 2.35 | |
| Harley-Davidson | 2.30 | |
| Kodak | 2.20 | |
| Activision Blizzard | 2.19 | |
| Star Wars | 2.08 |
Official Profiles
Login to view Contact
LoginArtist: Dead and Company
The map shows every radio station that aired Dead and Company today. Use the controls to highlight stations with the most or least airtime.
Top 10 Songs Played Today
- Radio airplay data is being collected. Please check back soon.
Total Streams
No streaming audience data is available for this artist yet.
Concerts
Upcoming events from today (UTC) to the next 6 months.
| Date/Time (UTC) | Event | Venue | Location | Tickets |
|---|---|---|---|---|
| No upcoming concerts found. | ||||


