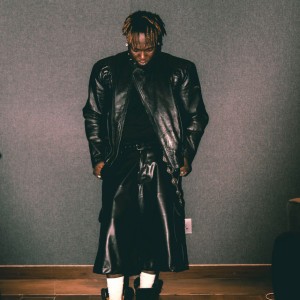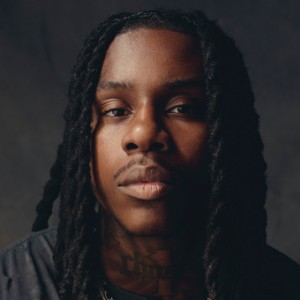
David Cook
Top Brand Affinity
Highest overlapping lifestyle brand
As of 2025-08-21
157,944
Social Media Followers
As of 2025-08-21
00:00:00
Hours Airplay
2026-01-21 18:39:15 UTC
Genres
Biography
In addition to his music career, Cook is dedicated to supporting the National Brain Tumor Society in honor of his late brother, Adam, who passed away from a brain tumor in 2009. Through his involvement with the charity and participation in the Race for Hope-DC, Cook and his fans have raised over $1.5 million for brain cancer research, a cause he holds close to his heart. This charitable work stands as one of Cook's proudest achievements alongside his musical accomplishments.
David Cook reliably reaches 18-24 & 25-34 audiences in UNITED STATES, PHILIPPINES, INDONESIA. The base is heavily female (58%), paving the way for collaborations that read as status, style, and scene. The strongest distribution channel is Youtube (14,116 avg views per post); Instagram layers on depth and replies. The audience sits near Live Nation, Dancing with the Stars, Influenster, making streetwear, music platforms, and lifestyle products a natural expansion. The partnership writes itself—and the comments back it up.
Artist Affinity estimates how strongly an artist's audience overlaps with interest in specific brands, products, and categories. It is derived from aggregated social and behavioral signals—who fans follow, save, click, and engage with—normalized across platforms. Higher affinity suggests better partnership fit and higher likelihood that fans will respond positively to branded content or offers. Use it to shortlist natural brand partners and product concepts that feel authentic to the audience. Combine affinity with Connection Strength (ER) and reach to balance fit with impact. Treat affinity as directional—validate with creative tests and small pilots before scaling.
Audience Demographics & Key Stats
| Metric | Value | Why It Matters |
|---|---|---|
| Social Snapshot |
Followers 157,944 · Engagements 712 · Rate 0.5% Posts 1,182 · Views 16,462 · Avg Likes 672 · Avg Comments 38 · Avg Views 16,462 |
Combine reach (followers/views) with ER to size both impact and responsiveness. |
| Age Breakdown |
18-24: 45% 25-34: 35% 35-44: 10% 13-17: 5% |
Largest: 18-24 (45%); next: 25-34 (35%) |
| Gender Split |
Female: 58% Male: 42% Non-binary/Other: 0% |
Skews female (58%) |
| Top Countries |
UNITED STATES (35%) PHILIPPINES (17%) INDONESIA (9%) BRAZIL (5%) NIGERIA (5%) |
Top regions: UNITED STATES (35%), PHILIPPINES (17%), INDONESIA (9%) |
| Platform Engagement | Instagram: 307 avg likes/post · Tiktok: 2,346 avg views/post · Youtube: 14,116 avg views/post | Best reach: Youtube 14,116 avg views; best engagement: Instagram 307 avg likes |
Top Brand Affinities
Live Nation
Dancing with the Stars
Influenster
Hot Topic
NBC
T.J. Maxx
Amazon Music
Macy's
Bath & Body Works
FOX
Power Rangers
Verizon
| Brand | Category | Score |
|---|---|---|
| Live Nation | 25.63 | |
| Dancing with the Stars | 16.18 | |
| Influenster | 10.78 | |
| Hot Topic | 9.76 | |
| NBC | 8.54 | |
| T.J. Maxx | 7.89 | |
| Amazon Music | 7.80 | |
| Macy's | 6.93 | |
| Bath & Body Works | 6.41 | |
| FOX | 6.25 | |
| Power Rangers | 6.00 | |
| Verizon | 5.94 | |
| Publix | 5.89 | |
| Margaritaville | 5.76 | |
| OLD NAVY | 5.76 | |
| Reese's | 5.60 | |
| Jollibee | 5.55 | |
| Target | 5.39 | |
| Kroger | 5.36 | |
| ULTA Beauty | 5.34 | |
| NHL | 5.27 | |
| iHeartRadio Music Awards | 5.14 | |
| Walgreens | 5.09 | |
| Busch | 4.99 | |
| PetSmart | 4.91 | |
| AMC | 4.82 | |
| Taco Bell | 4.60 | |
| Gillette | 4.53 | |
| Dunkin' Donuts | 4.51 | |
| Pfizer | 4.36 | |
| Chick-fil-A | 4.10 | |
| Walmart | 4.05 | |
| Paramount Pictures | 3.77 | |
| American Eagle | 3.68 | |
| Amway | 3.59 | |
| Bethesda Softworks | 3.57 | |
| Columbia Pictures | 3.56 | |
| Kate Spade | 3.56 | |
| NORDSTROM | 3.45 | |
| Summit Entertainment | 3.41 | |
| Snoopy And The Peanuts Gang | 3.37 | |
| ABC | 3.36 | |
| Pixar | 2.87 | |
| CBS | 2.84 | |
| MTV | 2.83 | |
| NFL | 2.74 | |
| Showtime | 2.72 | |
| Chipotle Mexican Grill | 2.72 | |
| Nickelodeon | 2.68 | |
| Universal | 2.61 |
Official Profiles
Login to view Contact
LoginArtist: David Cook
The map shows every radio station that aired David Cook today. Use the controls to highlight stations with the most or least airtime.
Top 10 Songs Played Today
- Radio airplay data is being collected. Please check back soon.
Total Streams
No streaming audience data is available for this artist yet.
Concerts
Upcoming events from today (UTC) to the next 6 months.
| Date/Time (UTC) | Event | Venue | Location | Tickets |
|---|---|---|---|---|
| No upcoming concerts found. | ||||


